Ethereum is currently navigating a decisive market phase following a massive weekly expansion that has redefined short-term expectations. Trading at $2,417, the second-largest digital asset has absorbed significant capital inflows, pushing its technical indicators into extreme territory. While the broader market sentiment remains elevated, short-term data reveals a potential exhaustion in buying pressure. Investors are now evaluating whether this momentum can break immediate ceilings or if a structural cooldown is imminent.
Key points about Ethereum:
- The asset recorded a striking 28.41% gain over the past seven days, establishing a strong bullish trend.
- The RSI stands at 72.32, placing the market in overbought territory and signaling a potential pause.
- Derivatives positioning is heavily skewed, with a 2.51 long/short ratio indicating aggressive speculative bets.
Ethereum and today’s key market signal
The current price action reflects a tug-of-war between sustained weekly momentum and intraday profit-taking. Traders are closely monitoring the volume profile to determine the sustainability of this recent rally.
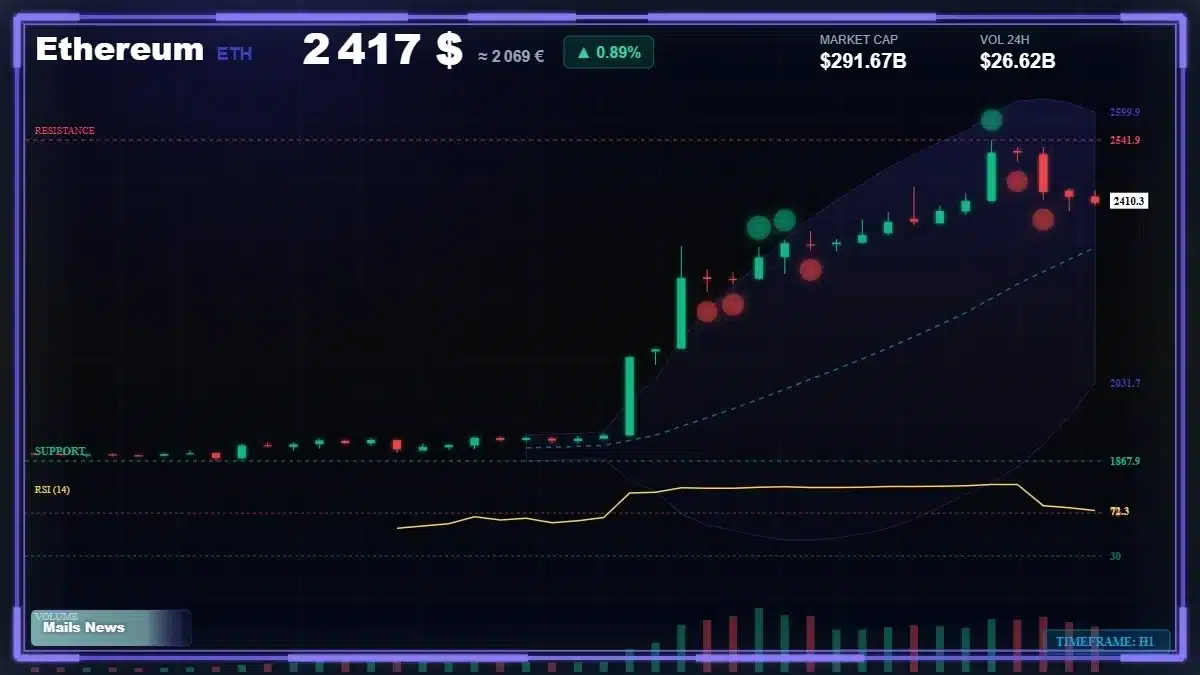
Price, volume and momentum
After surging 28.41% over the past week, the ETH price has encountered localized friction, evidenced by a 4.04% pullback over the last eight hours. Despite this intraday dip, the overall OHLC trend remains bullish at 28.02%. This divergence between the weekly triumph and the 8-hour correction suggests that the asset is digesting its recent gains. The relative volume is currently rising with a ratio of 5.56, indicating that market participants are actively repositioning their portfolios rather than stepping away from the order books.
This heightened activity occurs within a broader crypto market context where greed remains elevated. The rotation of capital, representing 9.13% of the market cap exchanged over 24 hours, confirms that liquidity is flowing steadily. However, tracking the latest ETH crypto news is essential, as macroeconomic shifts often dictate whether such high-volume consolidation resolves upward or downward.
The technical levels and signals to watch
With the asset trading near recent highs, technical indicators are flashing warning signs for late buyers. The chart structure highlights well-defined boundaries that will dictate the direction of the upcoming sessions.
The level that could confirm the scenario
For the bullish momentum to continue, the ETH/USD pair must decisively conquer the short-term resistance estimated at $2,542. Breaking and holding above this threshold would validate the recent volume surge and potentially open the door for further capital allocation. A successful breakout here would likely force late shorts to cover, adding mechanical buying pressure to the order flow. The broader News cycle remains a crucial catalyst for providing the fundamental tailwinds needed to breach this ceiling.
The threshold that would weaken the view
Conversely, the 14-period RSI currently sits at 72.32, a clear overbought signal. When a crypto ETH asset reaches this extreme, the probability of a mean-reversion event increases. If selling pressure intensifies, the primary technical safety net lies at the $1,868 support level. A drop below this zone would invalidate the immediate bullish setup and signal a deeper structural correction. Market observers are also comparing these technical battles across the sector, analyzing the Cardano Price Today ADA Tests Critical Resistance Levels to gauge overall altcoin resilience.
What flows and positioning reveal
Beyond spot market transactions, derivatives data exposes a highly leveraged environment. Traders are betting heavily on continuation, which introduces specific structural risks to the current price stability.
The spot flows that matter
The Binance Futures data reveals an open interest of $5.80 billion, coupled with a staggering long/short ratio of 2.51. This means that for every short position, there are more than two and a half long positions. While the funding rate remains relatively neutral at 0.0100%, this top-heavy positioning creates a moderate squeeze risk. If the price fails to break the $2,542 resistance and begins to slide, these leveraged longs could be forced into liquidation, accelerating any downward move.
Fundamentally, the DeFi ecosystem continues to provide a solid baseline, with total value locked remaining robust at $87.15 billion. However, external factors such as SEC regulatory actions or political shifts, highlighted by debates like Trump and Crypto Why the CLARITY Act is Blocked by Conflicts of Interest, can quickly alter institutional risk appetite. Meanwhile, retail investors continue to monitor alternative metrics, checking the Cardano price live and evaluating the Cardano price in euros to diversify their exposure across different smart contract platforms.
The metric that could shift the momentum
The primary tension moving forward lies in the conflict between the overbought RSI and the elevated futures open interest. Ethereum has demonstrated remarkable strength on the weekly timeframe, but the heavy concentration of long positions leaves the market vulnerable to sudden volatility spikes.
If the spot volume can absorb the inevitable profit-taking from early buyers, a measured consolidation below $2,542 would be the healthiest outcome for the bulls. However, if the leveraged positions begin to unwind, the asset could rapidly test its lower bounds. Traders will need to watch the 8-hour OHLC candles closely to determine if the current minor pullback is a standard breather or the beginning of a larger liquidation cascade.
Frequently asked questions about Ethereum
While the broader market sentiment remains elevated, short-term data reveals a potential exhaustion in buying pressure. Key points about Ethereum: The asset recorded a striking 28.41% gain over the past seven days, establishing a strong bullish trend. The RSI stands at 72.32 , placing the market in overbought territory and signaling a potential pause.
Trading at $2,417 , the second-largest digital asset has absorbed significant capital inflows, pushing its technical indicators into extreme territory. While the broader market sentiment remains elevated, short-term data reveals a potential exhaustion in buying pressure. Key points about Ethereum: The asset recorded a striking 28.41% gain over the past seven days, establishing a strong bullish trend.
Disclaimer: This article is for informational purposes only and does not constitute investment advice. Cryptocurrencies are volatile assets. Always conduct your own research before making any decision.